Voice Onset Time (VOT): Definitions and Measurement
By Howard Henry
Voice onset time is the interval, measured in milliseconds, between the release burst of a stop consonant and the moment the vocal folds begin vibrating. That single number tells you whether a sound is voiced, voiceless, or aspirated, and it does so more reliably than almost any other acoustic measurement in phonetics.
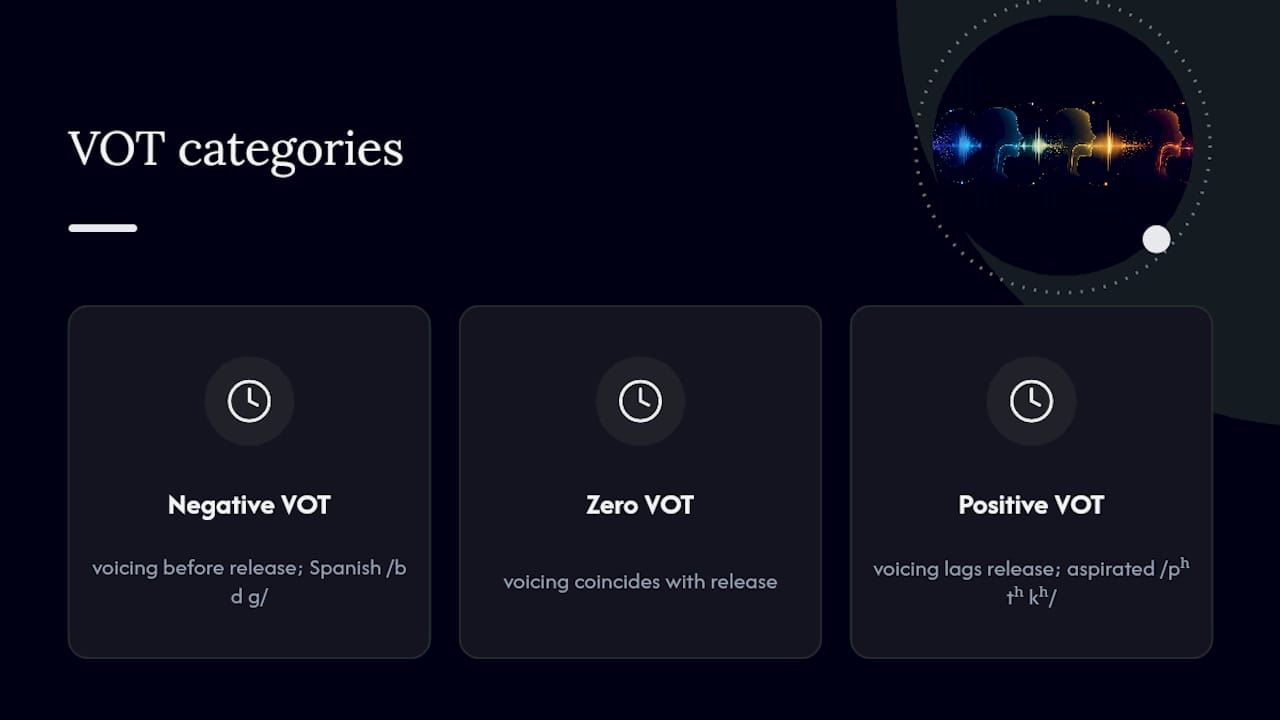
Three values matter. Positive VOT means voicing starts after the release burst, the hallmark of aspirated stops like English /pʰ/, /tʰ/, /kʰ/. Zero VOT means voicing begins at the same instant as the release, typical of unaspirated voiceless stops in many languages. Negative VOT means the vocal folds are already vibrating before the release, the signature of prevoiced stops such as Spanish /b d g/.
The measurement traces back to Lisker and Abramson’s 1964 cross-language study, which turned VOT from an observation into a standardized acoustic yardstick. More than sixty years later, it’s still the first thing a phonetics lab teaches and the first thing a speech scientist checks when a stop consonant sounds off.
Quick reference: A VOT of 0 ms means voicing coincides with stop release; positive values mean voicing lags behind release; negative values mean voicing leads release, often by 100 ms or more in heavily prevoiced languages.
Key Takeaways
Voice onset time works as a phonetic measurement because it converts an invisible laryngeal timing event into a precise, repeatable millisecond value that anyone can remeasure from a recording.
| Point | Details |
|---|---|
| Core definition | VOT is the millisecond gap between stop release and voicing onset, with positive, zero, and negative values marking distinct laryngeal timing patterns. |
| Historical foundation | Lisker and Abramson’s 1964 study established VOT as the standard cross-language measurement for voicing contrasts. |
| Measurement tool | Praat remains the standard software for marking release bursts and voicing onset on paired waveform and spectrogram views. |
| Watch for edge cases | Preaspiration, breathy voice, and unreleased stops all break the standard three-way VOT system and need adjusted labeling conventions. |
| Clinical application | Flowen shows live visual cues from microphone audio during speaking practice. These are practice estimates, not clinical measurements. |
Table of Contents
What voice onset time measures acoustically and physiologically
VOT captures the gap between two acoustic events you can actually see on a spectrogram: the release burst, a brief spike of broadband energy when the articulators separate, and the onset of voicing, the point where regular, periodic waveform cycles begin. Between those two landmarks, you often see aspiration, a patch of aperiodic noise that looks like static on the spectrogram and sounds like a puff of air on the recording.

The physiology behind this timing comes down to when the vocal folds start vibrating relative to when air escapes past the constriction. For positive VOT, the glottis stays open after release, air rushes through unimpeded, and voicing only kicks in once the folds adduct and airflow pressure conditions allow oscillation. For zero VOT, glottal adduction and oral release happen almost simultaneously. For negative VOT, the vocal folds are already vibrating during the stop closure itself, and that voicing continues right through the release.
Underlying all three patterns is a simple aerodynamic fact: vocal-fold vibration needs a minimum subglottic pressure to start, called the phonation threshold pressure. That threshold shifts with laryngeal muscle tension and vocal-fold stiffness, which is part of why VOT values vary not just across languages but across individual speakers and even across repetitions by the same speaker.
When you’re locating these landmarks in a recording, check for:
-
Release burst: a short vertical spike of energy across a wide frequency range, usually under 10 ms wide.
-
Aspiration noise: aperiodic, hiss-like energy filling the formant space right after the burst, present only in positive VOT tokens.
-
Voicing onset: the first clear glottal pulse, visible as a regular vertical striation pattern on a wideband spectrogram and as repeating waveform cycles on the oscillogram.
-
Closure voicing (for negative VOT): low-frequency periodic energy visible during the stop closure, before the burst even occurs.
-
F1 onset: the first formant typically ramps up gradually after voicing starts, giving you a secondary check on your voicing-onset mark.
A short history of how VOT became the standard measurement
Stop consonants were notoriously hard to compare across languages until Leigh Lisker and Arthur S. Abramson published their landmark 1964 study, which measured voicing timing across eleven languages and showed that a single acoustic dimension explained most of the perceptual voicing contrasts phoneticians had been describing impressionistically for decades. Abramson continued refining VOT methodology for decades afterward, and the term he and Lisker coined stuck because it did something rare in phonetics: it replaced a subjective auditory judgment with a number anyone could remeasure.
VOT has remained a robust and widely used acoustic measure for capturing laryngeal timing distinctions across languages for more than fifty years, even as researchers have refined how to handle its trickiest edge cases, according to a review marking its fiftieth anniversary in the Journal of Phonetics.
That durability isn’t an accident. VOT survived because it correlates tightly with a real physiological event (the timing of glottal adduction relative to oral release) rather than an abstract phonological category. Later work extended the framework to handle prevoicing, aspiration continua, and cross-linguistic timing categories that Lisker and Abramson’s original three-way system didn’t fully anticipate.
If you’re building a reading list, start here:
-
Lisker, L., & Abramson, A. S. (1964). A cross-language study of voicing in initial stops: Acoustical measurements. Word, 20(3).
-
Abramson, A. S., & Whalen, D. H. (2017). Voice Onset Time (VOT) at 50: Theoretical and practical issues in measuring voicing distinctions. Journal of Phonetics, 63, 75-86.
-
Any modern Praat-based tutorial on stimulus synthesis, which shows how the original measurement gets applied in experimental work today.
Negative, zero, and positive VOT explained with examples
Each VOT category corresponds to a distinct laryngeal gesture, and once you’ve heard a few clean examples, you can often identify the type by ear before you even open a spectrogram.
Negative VOT occurs when voicing begins during the stop closure and continues through the release, common in Spanish, French, and many Romance and Slavic languages. English speakers producing /b d g/ in initial position often use short-lag voicing (near zero) rather than true prevoicing, which is one reason English /b/ can sound different from Spanish /b/ to a trained ear. Typical prevoiced tokens show VOT values of negative 75 to negative 125 ms, with the closure voicing visible as a low, dense band on the spectrogram well before any burst appears.
Zero VOT, also called short-lag voicing, describes voiceless unaspirated stops where the burst and voicing onset happen within a few milliseconds of each other. French, Spanish, and Hindi voiceless stops (/p t k/, unaspirated) typically fall in the 0 to 25 ms range. Perceptually, these sounds land in a gray zone for English listeners, who often mishear them as voiced because English lacks a clean short-lag category of its own.
Positive VOT, or long-lag voicing, marks aspirated stops where a visible gap of noise separates the burst from voicing onset. English voiceless stops in stressed initial position (/pʰ tʰ kʰ/) typically measure 40 to 80 ms, and Thai and Hindi aspirated stops can run considerably longer.
-
Negative VOT: voicing precedes release; spectrogram shows periodic energy before the burst; heard as a “fully voiced” stop.
-
Zero VOT: voicing and release nearly coincide; minimal or no visible aspiration noise; heard as crisp, unaspirated.
-
Positive VOT: voicing follows release by a clear margin; a noise band of aspiration fills the gap; heard as a breathy or aspirated stop.
A useful benchmark: English alveolar stops often show roughly 95 ms VOT for /t/ versus roughly 25 ms for /d/, a 70 ms gap that’s easy to spot on a spectrogram once you know where to look.
How to measure voice onset time step by step
Measuring VOT reliably comes down to consistent landmark identification, and Praat remains the standard tool for the job because it lets you view waveform and spectrogram together while placing precise, time-locked labels.
-
Import your recording into Praat and open it in the combined Sound and TextGrid editor.
-
Create a TextGrid with at least two interval tiers: one for the release burst, one for the voicing/closure status.
-
Zoom in on the target stop consonant until individual glottal pulses are visible on the waveform.
-
Mark the release burst boundary at the first vertical spike of broadband energy on the wideband spectrogram.
-
Mark voicing onset at the first regular waveform cycle following the burst (for positive VOT) or the first cycle during closure (for negative VOT).
-
Calculate VOT as the time difference between the two marks, in milliseconds, keeping the sign convention consistent (positive for voicing lag, negative for voicing lead).
-
Export your TextGrid and durations using Praat’s built-in scripting console for batch analysis across multiple files.
For any dataset larger than a handful of tokens, hand-labeling every file wastes time you don’t need to lose. Praat scripts can automate boundary extraction once you’ve manually labeled a training subset, and the progressive cutback and replacement method described in a widely cited Praat tutorial gives you a reproducible way to both measure and synthesize VOT continua while keeping covarying cues like F0 and intensity under control.
Even with a solid workflow, a few problems come up constantly:
-
Background noise obscuring the exact onset of aspiration, especially in field recordings.
-
Overlapping voicing and aspiration in casual, fast speech, where the boundary blurs.
-
Ambiguous or “soft” bursts in fricated or affricated releases that don’t produce a clean spike.
-
Automated detection algorithms misfiring on atypical speech, which is why manual cross-checking against automated output remains standard practice in careful studies.
-
Speaker-specific creaky voice or vocal fry near the voicing boundary, which can make onset look later or earlier than it acoustically is.
Pro Tip: When a token’s voicing onset looks ambiguous on the waveform alone, switch to a wideband spectrogram and look for the first clear vertical striation. Cross-checking the two views resolves the vast majority of borderline cases without needing a second listener.
Notating VOT in transcription and research reports
The International Phonetic Alphabet handles VOT contrasts through diacritics rather than separate letters. Aspiration gets marked with a superscript h, as in [pʰ], [tʰ], [kʰ], while prevoicing sometimes gets marked with a small circle diacritic under a voiceless symbol or simply described numerically in methods sections, since IPA has no universal single symbol for degree of prevoicing.
For research reporting, raw millisecond values beat categorical labels every time you’re comparing across studies. A methods section should state sampling rate (44.1 kHz or higher is standard), spectrogram window settings (a wideband analysis window around 5 ms is typical for resolving individual glottal pulses), and the specific labeling rule used for burst and voicing onset. When summarizing across many tokens, report both the range and either the mean with standard deviation or the median with interquartile range, since VOT distributions are often skewed rather than perfectly symmetric.
VOT ranges across English, Spanish, Thai, and beyond
Typical VOT values shift depending on place of articulation and the phonological inventory of the language in question, which is exactly why cross-language comparison work matters so much in this field.
-
English: voiceless aspirated stops average 40 to 80 ms; voiced stops often sit near 0 to 25 ms rather than true negative values.
-
Spanish: voiceless stops are unaspirated, typically 0 to 25 ms; voiced stops are genuinely prevoiced, often negative 75 to negative 125 ms.
-
Thai: contrasts three categories at the same place of articulation, including a long-lag aspirated series that can exceed 90 ms.
-
Hindi: distinguishes four stop categories per place of articulation, including breathy-voiced stops, giving it one of the richest VOT inventories documented.
-
Navajo: aspirated velars run notably longer than English equivalents, with reported values near 160 ms compared to roughly 80 ms for English /kʰ/.
Place of articulation itself shifts VOT independent of language: velar stops generally show longer positive VOT than bilabials or alveolars, because the larger surface contact at the velum takes longer to release fully. Speaking rate compounds this. Faster speech compresses VOT values across the board, which is one reason a single “typical” number for any given language is really a range, not a fixed constant.
When VOT measurements get complicated
VOT is a clean concept until real speech data introduces friction. Speaking rate alone can shift VOT values by tens of milliseconds within a single speaker, and coarticulation with adjacent vowels can blur the exact release-burst boundary. Prosodic position matters too: stressed, phrase-initial stops tend to show longer positive VOT than the same phoneme in unstressed or medial position.
Certain phonetic patterns break the standard three-way system outright. Breathy voice, common in Hindi and Gujarati, produces a murmured voicing quality that makes pinpointing exact onset difficult even on a clean spectrogram. Preaspiration, found in Icelandic and some Scandinavian varieties, puts a noise interval before the stop closure rather than after release, which the standard VOT definition wasn’t built to capture cleanly. Unreleased final stops, common in casual English and many other languages, have no burst at all, making VOT measurement impossible in the traditional sense. Partial voicing during closure, where the vocal folds vibrate briefly then stop before the burst, creates genuine ambiguity about where to place the negative-VOT boundary.
Standard VOT measurement assumes a clean, separable sequence of closure, release, and voicing onset, but real speech regularly produces preaspiration, breathy phonation, and partial closure voicing that this assumption doesn’t cover, which is why the field continues developing supplementary labeling conventions for these edge cases.
When you hit these cases in your own data, report medians alongside means, flag outliers explicitly rather than silently excluding them, and describe your labeling decision for the ambiguous tokens in your methods section so other researchers can evaluate or replicate your choices.
Reporting VOT clearly: visuals, stats, and reproducibility
Good VOT reporting gives another researcher everything they’d need to remeasure your data and get the same numbers. That starts with the figures you choose to show.
A combined waveform and wideband spectrogram panel, with your release-burst and voicing-onset marks annotated directly on the image, communicates more in one glance than a paragraph of description. Per-token scatter plots showing VOT distribution by category (negative, zero, positive) reveal overlap and outliers that summary statistics alone can hide.
For reproducibility, your methods section or supplementary materials should include:
-
Sampling rate and recording equipment used for the original data collection.
-
Spectrogram analysis window length and frequency range settings.
-
The exact labeling rule for burst onset and voicing onset, stated as a decision procedure, not just a description.
-
Any Praat script or automated pipeline used, ideally shared as a supplementary file.
-
Interrater agreement statistics if more than one person labeled the data.
For summary statistics, mean and standard deviation work fine for roughly symmetric distributions within a single VOT category, but median and interquartile range handle the skew that often shows up when negative and positive tokens get pooled together. Kernel density plots are worth the extra effort when you’re comparing VOT distributions across two or more groups, since they show multimodality that a single mean would flatten out entirely.
Where VOT measurement actually gets used
VOT isn’t just a lab curiosity. It anchors several distinct lines of work across linguistics, psychology, and clinical practice.
-
Phonological research: VOT provides the acoustic evidence behind phonemic voicing contrasts, letting researchers document and compare stop inventories across the world’s languages.
-
Speech perception experiments: synthesized VOT continua are the standard stimulus type for studying categorical perception, and neurophysiological work has traced how VOT differences map onto temporal encoding in auditory cortex.
-
Second language acquisition: learners frequently transfer their first language’s VOT categories onto a new language, which is a major source of the “accent” native listeners detect even when individual sounds are otherwise correct. A Spanish speaker producing unaspirated English /p/ or an English speaker failing to prevoice Spanish /b/ are both VOT transfer errors.
-
Clinical assessment: articulatory timing disorders, certain motor speech conditions, and some voice pathologies show up as atypical VOT patterns, making it a useful, non-invasive marker for tracking change over time.
VOT in clinical assessment and biofeedback practice
Clinicians working on articulatory timing disorders increasingly use VOT-adjacent measurements to track whether a client’s voicing coordination is shifting session over session, not just whether a sound is perceptually “correct” on a given day. This matters most in retraining contexts, where a clinician needs objective, repeatable evidence that a client’s laryngeal timing is moving in the right direction, not just an auditory impression that can vary between listeners.
Real-time acoustic feedback platforms extend this idea beyond the clinic. Browser-based tools such as Flowen analyse microphone audio and show live visual cues through an animated avatar display, so a person practising at home gets moment-by-moment feedback without interpreting a spectrogram. The cues are practice estimates based on acoustic features such as amplitude and pitch, not clinical measurements of laryngeal tension or voicing coordination.
VOT and related timing measures can flag when articulatory or laryngeal coordination is off track, but they describe a single acoustic dimension. No timing measurement alone diagnoses a specific speech or voice disorder, and clinicians need multimodal assessment, including auditory-perceptual judgment and case history, to interpret what a timing anomaly actually means for a given client.
What students consistently get wrong about VOT
A mistake is treating VOT as a fixed property of a phoneme rather than a distribution shaped by speaking rate, stress, and coarticulatory context. A single measurement from one token tells you almost nothing; a distribution across dozens of tokens tells you a great deal.
The second mistake is measuring VOT in isolation and ignoring covarying cues. F0 onset frequency and intensity both shift alongside VOT, and treating VOT as the sole acoustic correlate of a voicing contrast will lead you to misinterpret ambiguous or borderline data.
Start with clean, stressed, phrase-initial tokens before tackling connected speech. Always check your voicing-onset mark against both the waveform and a wideband spectrogram before committing to a value. A good classroom exercise: have every student independently label the same 20 tokens, then compare interrater agreement. The disagreements teach you more about measurement ambiguity than any textbook chapter can.
A practical option for clinical VOT-informed training
Flowen gives clinicians and clients a way to work directly with the timing patterns this article covers, without needing a spectrogram open during every session. Flowen shows live visual cues driven by microphone audio, based on acoustic features such as amplitude and pitch, through an animated avatar display, and the individual plan includes dynamic easy-onset prompts. Someone practising gets immediate feedback rather than waiting for after-the-fact analysis.

Session history and practice activity are saved to the account, and assigned clinician accounts can review their caseload’s session activity. Clinician access is permission-based, and a subscription does not supply a therapist. Flowen’s security page describes its data-handling mechanisms and their limits; it is not an audit or compliance attestation. Individual pricing is public on the pricing page, and organisational access is handled by enquiry. Speech and language therapists can use the clinician page to see what is available and discuss a demonstration.
Frequently Asked Questions
What is a normal VOT value for English stops? English voiceless aspirated stops (/pʰ tʰ kʰ/) typically measure 40 to 80 ms, while voiced stops (/b d g/) usually fall near 0 to 25 ms rather than showing true prevoicing.
How do you measure VOT in Praat? Open your recording in Praat’s Sound and TextGrid editor, zoom into the target stop, mark the release burst on the wideband spectrogram, mark the first regular voicing cycle, then calculate the time difference in milliseconds between the two marks.
What’s the difference between VOT and aspiration? VOT is the full millisecond measurement between release and voicing onset. Aspiration is the audible noise that fills part of that interval in positive-VOT stops; a stop can have positive VOT with weak or minimal audible aspiration.
Can VOT be negative? Yes. Negative VOT means voicing begins during the stop closure and continues through release, characteristic of prevoiced stops in Spanish, French, and many other languages, often measuring negative 75 to negative 125 ms.
Why does VOT vary so much even within one language? Speaking rate, stress, place of articulation, and coarticulation with neighboring sounds all shift VOT values, which is why researchers report distributions and ranges rather than single fixed numbers per phoneme.
Is VOT useful for diagnosing speech disorders? VOT can flag atypical articulatory or laryngeal timing worth investigating further, but it’s one acoustic dimension among several. Clinicians combine it with auditory-perceptual assessment and case history rather than using it alone for diagnosis.
Sources
Start with the primary literature before moving to secondary summaries. The original Lisker and Abramson framework and its fiftieth-anniversary retrospective remain the essential theoretical foundation, covering both the classic three-way system and the problematic cases that have emerged since.
For hands-on measurement work, the Praat tutorial on VOT manipulation provides a flexible script for both measuring and synthesizing VOT continua, useful whether you’re analyzing natural speech or building perception-experiment stimuli. Pair it with a phonation threshold pressure tutorial if your work touches the aerodynamic side of voicing onset.
-
Manipulation of voice onset time in speech stimuli: A tutorial and flexible Praat script
-
Temporal encoding of the voice onset time phonetic … - PubMed