Patient Engagement Metrics: A Guide for Healthcare Administrators
By Howard Henry
Track eight core outcome metrics — one per Engage with Impact domain — plus two cross-cutting process metrics (engagement reach and representativeness). That compact set, grounded in concept mapping across 237 impact statements and validated by an expert working group, gives you a measurement program you can pilot within months rather than years.
Your minimal starting set:
-
Knowledge and skills: self-reported confidence in managing health (pre/post survey)
-
Confidence and trust: Patient Activation Measure (PAM) score
-
Equity and inclusivity: demographic representativeness index of engaged participants
-
Priorities and decisions: shared decision-making scale score (e.g., SDM-Q-9)
-
Effectiveness and efficiency: care plan adherence rate (EHR-derived)
-
Patient-centredness: Friends and Family Test (FFT) net score
-
Culture change: staff-reported patient involvement in service design (survey)
-
Patient outcomes and experience: PROMs/PREMs composite (e.g., EQ-5D + PREM item set)
-
Cross-cutting process 1: engagement reach (% of eligible patients contacted)
-
Cross-cutting process 2: representativeness (demographic match to service population)
Key Takeaways
The most effective patient engagement measurement program combines one validated outcome metric per Engage with Impact domain with two cross-cutting process metrics, piloted before scale-up and linked to named improvement actions.
| Point | Details |
|---|---|
| Start with 10 metrics | Eight domain metrics plus reach and representativeness cover the full framework without overwhelming teams. |
| PAM and FFT are your anchors | PAM predicts outcomes and responds to intervention; FFT is NHS-mandated and low-burden to collect. |
| Disaggregate from day one | Aggregate scores hide equity gaps; stratify by protected characteristic in the first pilot wave. |
| Pilot before scaling | A 6–8 week pilot with 50+ participants validates instruments and action triggers before full rollout. |
| Link every metric to an owner | A metric without a named owner and a decision threshold will not drive change. |
Table of Contents
-
Turning metrics into decisions: dashboards and reporting routines
-
Six-step implementation checklist for a first 6-month rollout
-
Building measurement programs that last
Why measuring patient engagement changes outcomes
Measurement is not an administrative exercise. It is the mechanism by which engagement work earns organizational credibility and drives resource decisions.
CDC evidence shows that higher patient activation, measured by PAM, predicts better self-management, more proactive health information seeking, and lower downstream costs. Activation is also responsive to intervention, which means a rising PAM score is a signal your program is working, not just a baseline curiosity.
The AHRQ Technical Brief mapped 134 systematic reviews and found the strongest evidence base at the direct care level: self-management support and shared decision making produce measurable effects on adherence and disease control for chronic conditions. Technology-enabled delivery modes, including portals and remote monitoring, show consistent promise.
For administrators, measurement delivers four concrete benefits:
-
Quality improvement: metrics surface which patient groups are not improving, so teams can adjust protocols.
-
Resource allocation: utilization and activation data justify staffing and program investment.
-
Equity monitoring: representativeness metrics reveal who is being left out before disparities widen.
-
Accountability: documented outcomes support commissioning renewals and board reporting.
The 8-domain framework that organizes your metric selection
The Engage with Impact toolkit reduced 237 initial impact statements to 35 items mapped across eight domains, with a core item identified for each. Use this structure as your organizing framework — it prevents the common error of measuring only what is easy to collect.
| Domain | Typical metric examples | Process vs. outcome | Measurement level |
|---|---|---|---|
| Knowledge and skills | Self-efficacy score, health literacy assessment | Outcome | Participant |
| Confidence and trust | PAM score, therapeutic alliance rating | Outcome | Participant |
| Equity and inclusivity | Representativeness index, language access rate | Process | Programme / System |
| Priorities and decisions | SDM scale score, patient-reported goal alignment | Outcome | Participant / Programme |
| Effectiveness and efficiency | Appointment adherence, care plan completion | Process | Programme / Organisation |
| Patient-centredness | FFT score, PREM composite | Outcome | Programme / Organisation |
| Culture change | Staff survey on patient involvement, co-design participation rate | Process | Organisation |
| Patient outcomes and experience | EQ-5D, condition-specific PROM, readmission rate | Outcome | Participant / System |
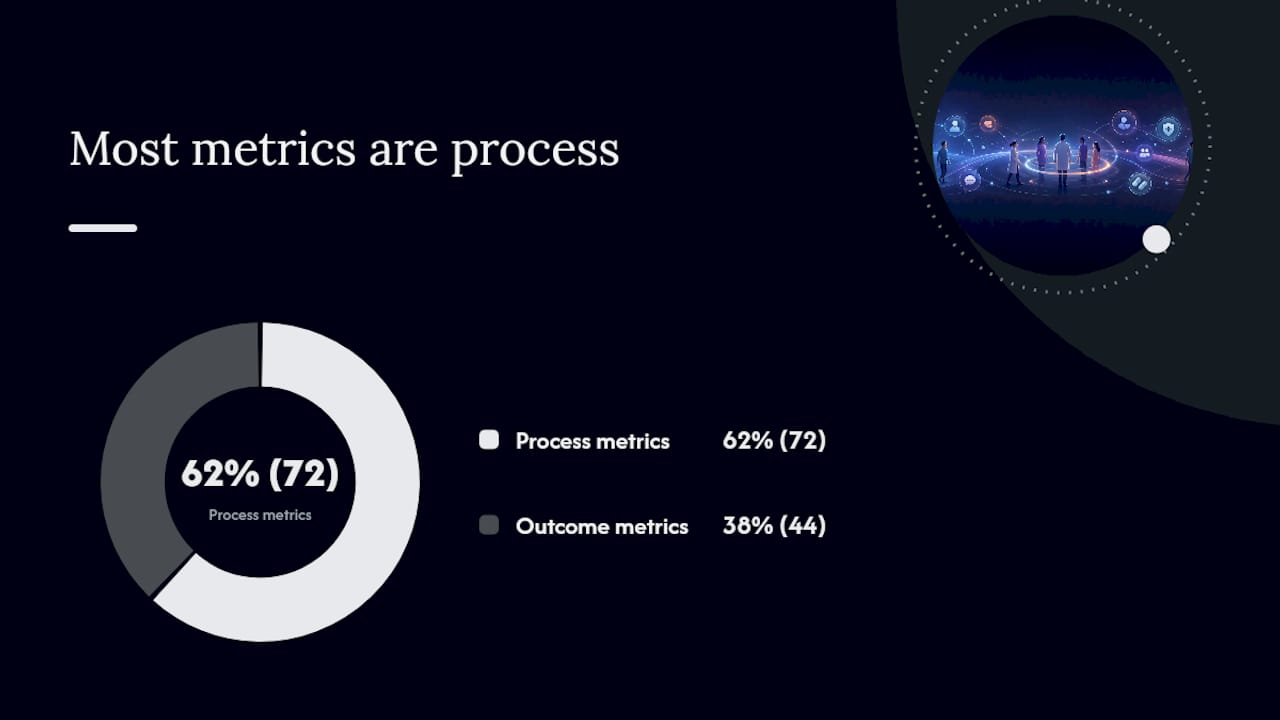
The IJHPM taxonomy of 116 engagement metrics found 72 process metrics versus 44 outcome metrics across 23 reviewed tools, and no single tool covered the full taxonomy. That gap is why a multi-domain framework matters: you will always need to combine instruments rather than rely on one.
The operational shortlist you can implement in months
One high-value metric per domain, plus two process metrics, keeps your program feasible without sacrificing coverage.
| Metric | Type | Level | Data source | Frequency / lag | Feasibility | Actionability |
|---|---|---|---|---|---|---|
| PAM score | Outcome | Participant | Survey | Quarterly / 2-week lag | Medium | High: triggers coaching escalation |
| Self-efficacy score | Outcome | Participant | Survey | Pre/post programme | Low | High: flags knowledge gaps |
| SDM-Q-9 score | Outcome | Participant | Survey | Per consultation | Low | High: prompts clinician training |
| FFT net score | Outcome | Programme | Survey | Monthly / 1-week lag | Low | High: drives service adjustments |
| Care plan adherence | Process | Programme | EHR | Monthly / 2-week lag | Medium | Medium: triggers outreach |
| Representativeness index | Process | Programme / System | Admin data | Quarterly / 1-month lag | Medium | High: informs recruitment strategy |
| Staff involvement survey | Process | Organisation | Survey | Biannual | Low | Medium: informs governance |
| EQ-5D + PREM composite | Outcome | Participant / System | Survey | Pre/post / annual | Medium | High: supports commissioning case |
| Engagement reach | Process | Programme | Admin / digital logs | Monthly | Low | High: flags access barriers |
Standard instruments to use: PAM (Insignia Health licensed tool) for activation; FFT (NHS-mandated) for experience; EQ-5D (EuroQol Group) for health status PROMs; validated PREM item sets for experience. Introduce condition-specific PROMs where a generic instrument lacks sensitivity.
How to choose the right measures for your setting
Choose metrics by applying five lenses: validity (does it measure what you claim?), feasibility (can your team collect it without unsustainable burden?), actionability (does a result trigger a clear next step?), sensitivity to change (will it move within your program’s timeframe?), and equity impact (does it capture underserved groups?).
A simple decision flow:
-
Small clinic (under 500 patients): prioritize PAM, FFT, and engagement reach. Skip staff involvement survey until year two.
-
Large trust or integrated care system: run the full eight-domain set; segment all metrics by protected characteristics from day one.
-
Digital-first service: add portal login rate and message response time from digital engagement logs; weight technology-enabled metrics more heavily.
Workshop checklist for a 30–60 minute stakeholder session:
-
List your top three service improvement questions.
-
Map each question to one or two domains from the framework.
-
Score candidate metrics on all five lenses (1–3 scale).
-
Drop any metric scoring 1 on actionability — it will not drive change.
-
Confirm data ownership and collection route for each retained metric.
Pro Tip: When adjusting for equity, stratify every survey by language preference and digital access status from the first pilot wave. Aggregated scores mask disparities; disaggregated data is where the real gaps appear.
What data sources and collection methods work best
Combine at least two data sources: one structured quantitative source (EHR, PROM, or PAM survey) and one qualitative source (patient interviews or open-text PREM items). Quantitative data tells you what is happening; qualitative data tells you why.

| Method | Best for | Burden | Data quality notes |
|---|---|---|---|
| PAM / PREM surveys | Activation, experience | Low–medium | Validated; watch for response bias |
| EHR and admin data | Utilization, adherence | Low (automated) | Completeness varies by system |
| Digital engagement logs | Portal use, message rates | Low (automated) | Requires consent and anonymization |
| Structured patient interviews | Culture change, priorities | High | Rich context; not scalable alone |
| Routine administrative data | Reach, representativeness | Low | Demographic fields often incomplete |
Self-management support strategies delivered via digital modes, including portals, SMS reminders, and remote monitoring, show measurable effects on adherence for chronic conditions, per AHRQ evidence. Digital engagement logs are therefore worth capturing even if your current EHR does not surface them automatically.

For sampling: aim for a minimum of 30 responses per subgroup for any equity stratification to be statistically meaningful. Run surveys at consistent intervals so trend data is comparable. Obtain explicit informed consent for any data linked to identifiable records, and anonymize dashboard outputs before sharing across teams.
Turning metrics into decisions: dashboards and reporting routines
Dashboards must connect each metric to a clear improvement action and a named audience. A board panel showing PAM trend lines serves a different purpose than a clinician-facing alert on care plan adherence. Design for the decision, not the data.
Recommended KPIs from the core shortlist:
-
PAM score trend (quarterly, by care pathway)
-
FFT net score (monthly, by service unit)
-
Engagement reach rate (monthly, flagged if below 70%)
-
EQ-5D change score (pre/post programme)
-
Representativeness index (quarterly, by protected characteristic)
-
Care plan adherence rate (monthly, by clinician team)
Reporting cadence:
-
Weekly operational: engagement reach and care plan adherence for frontline teams; trigger outreach if reach drops.
-
Monthly tactical: FFT score, adherence trend, and portal use for service managers; review against improvement targets.
-
Quarterly board: PAM trend, EQ-5D outcomes, representativeness index, and equity flags; link to commissioning narrative.
On the technical side, anonymize all patient-level data before it enters shared dashboards, apply role-based access permissions, and document your data governance policy. Whatever tools you use, review each vendor’s current privacy and security documentation as part of procurement due diligence. Flowen, for example, publishes a security page describing its data-handling mechanisms and their limits; it is not an independent audit or compliance attestation.
Piloting and validating measures before you scale
Always pilot core metrics with a representative sample before organization-wide rollout. Validation protects you from scaling a metric that does not actually measure what you think it does.
Pilot checklist:
-
Select a representative sample (minimum 50 participants across demographic groups).
-
Run the pilot for 6–8 weeks, long enough to capture at least one reporting cycle.
-
Define success criteria upfront: acceptable response rate (target above 60%), data completeness above 80%, and at least one process change triggered by a metric result.
-
Test face validity with patient partners before launch — ask three to five patients whether each survey item makes sense.
-
Check test-retest reliability: administer the same instrument twice within two weeks to a small subsample and compare scores.
-
Assess sensitivity to change: compare scores before and after a known intervention to confirm the metric moves.
Interpretation guidance: A rising PAM score alongside a flat EQ-5D suggests activation is improving but clinical outcomes need more time or a different intervention. A falling FFT score with stable adherence points to a communication or relationship issue rather than a clinical one. When a metric fails to move after two full cycles despite a known intervention, revisit the instrument’s sensitivity before concluding the program is ineffective.
Common pitfalls in measuring patient engagement
The biggest failures come from poor sampling, metrics with no linked action, and survey burden that erodes clinician trust in the whole program.
-
Unrepresentative samples: only surveying patients who attend regularly skews every metric. Mitigation: include non-attenders and lapsed patients in reach calculations.
-
Metrics without owners: if no named role is responsible for acting on a result, the metric will not drive change. Mitigation: assign a named owner at the pilot stage.
-
Survey fatigue: sending three separate surveys per appointment destroys response rates. Mitigation: consolidate to one instrument per touchpoint; use embedded PREM items in existing communications.
-
Surrogate process metrics mistaken for outcomes: attendance rate is not the same as engagement quality. Mitigation: pair every process metric with at least one outcome metric from the same domain.
-
Ignoring equity in aggregates: a high average FFT score can hide a poor experience for one demographic group. Mitigation: disaggregate every metric by protected characteristic from the first reporting cycle.
-
Identifiable data in shared dashboards: displaying patient-level data in multi-user dashboards creates GDPR risk. Mitigation: anonymize at the point of aggregation and apply role-based access controls.
Measuring engagement without a linked improvement action is data collection, not evaluation. Every metric in your program should have a named owner, a decision threshold, and a documented response protocol before it goes live.
Six-step implementation checklist for a first 6-month rollout
Follow this sequence to move from planning to first-cycle reporting in approximately 3–6 months, depending on organizational scale. Resourcing tools like the PIMSY caseload capacity calculator can help you model analyst time against existing clinical capacity, particularly given that documentation and admin time materially reduce available hours.
-
Governance and stakeholder buy-in (weeks 1–3): Convene a metric-selection working group including patient partners, clinicians, and a data analyst. Agree on the program’s top three improvement questions.
-
Select metrics (weeks 3–5): Apply the five-lens scoring framework. Retain a maximum of 10 metrics for the pilot phase.
-
Data pipelines and consent (weeks 4–7): Map each metric to its data source. Confirm EHR extraction routes, survey platform, and consent language. Anonymize outputs.
-
Pilot validation (weeks 6–12): Run the pilot with a minimum of 50 participants. Validate face validity, test-retest reliability, and sensitivity to change.
-
Dashboard build (weeks 10–14): Build one panel per audience (clinician, manager, board). Link each KPI to a named improvement action and a reporting threshold.
-
Scale and quality assurance (weeks 14–24): Roll out to the full service. Establish a quarterly metric review cycle to retire underperforming metrics and add new ones as the program matures.
Building measurement programs that last
Measurement sustains engagement programs by making their value visible to decision-makers who control budgets.
Three practical tips:
-
Co-design metrics with patient partners from the start. Metrics designed without patient input frequently miss what patients actually care about, producing data that is technically correct but clinically irrelevant.
-
Guard against survey fatigue ruthlessly. One well-designed instrument per touchpoint, embedded in existing workflows, outperforms five standalone surveys every time.
-
Align your metrics with existing quality improvement cycles. A metric that feeds directly into a QI board agenda gets acted on. One that lives in a separate report does not.
One pilot metric that successfully triggers a process change is worth more than twenty metrics that sit in a spreadsheet. Start small, demonstrate impact, then expand.
Sources
-
Technical Brief 36: Strategies for Patient, Family, and Caregiver Engagement (AHRQ)
-
Systematic review and taxonomy of P2C2 engagement metrics (IJHPM 2018)